
See your site through your users' eyes
Visualize user behavior with heatmaps, clickmaps, and scrollmaps. Discover where users click, how far they scroll, and where they get frustrated.
Install with AI in a single prompt
Paste into your terminal or code editor and make AI do the work.
What does it do?
Heatmaps show you how users interact with elements on your website or app. Visualize clicks, mouse movements, and scrolling behavior, then find frustration through dead clicks and rageclicks.
Who is it for?
How do I use it?
On your live site
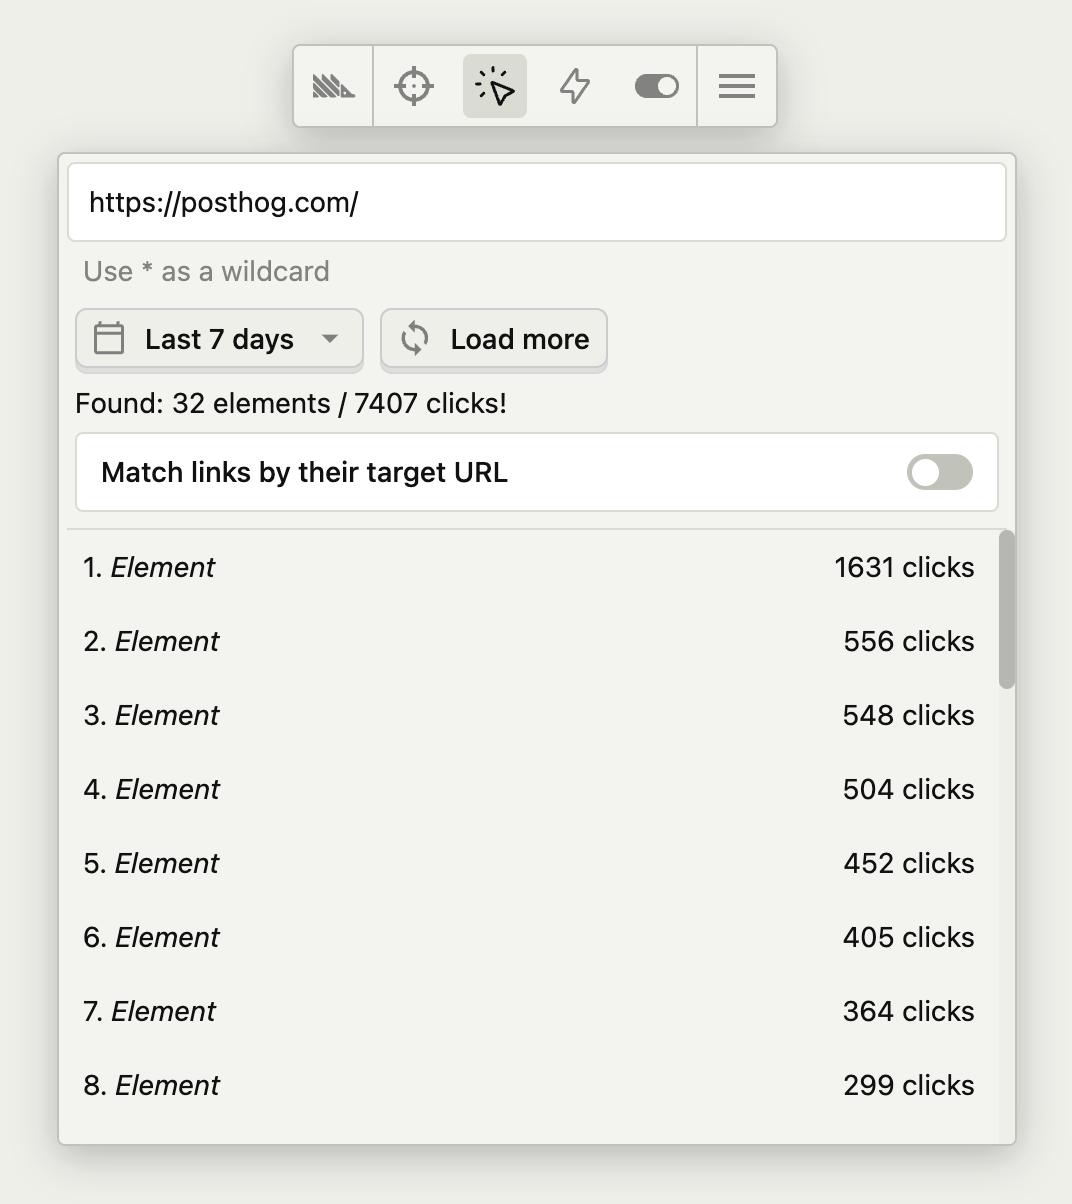
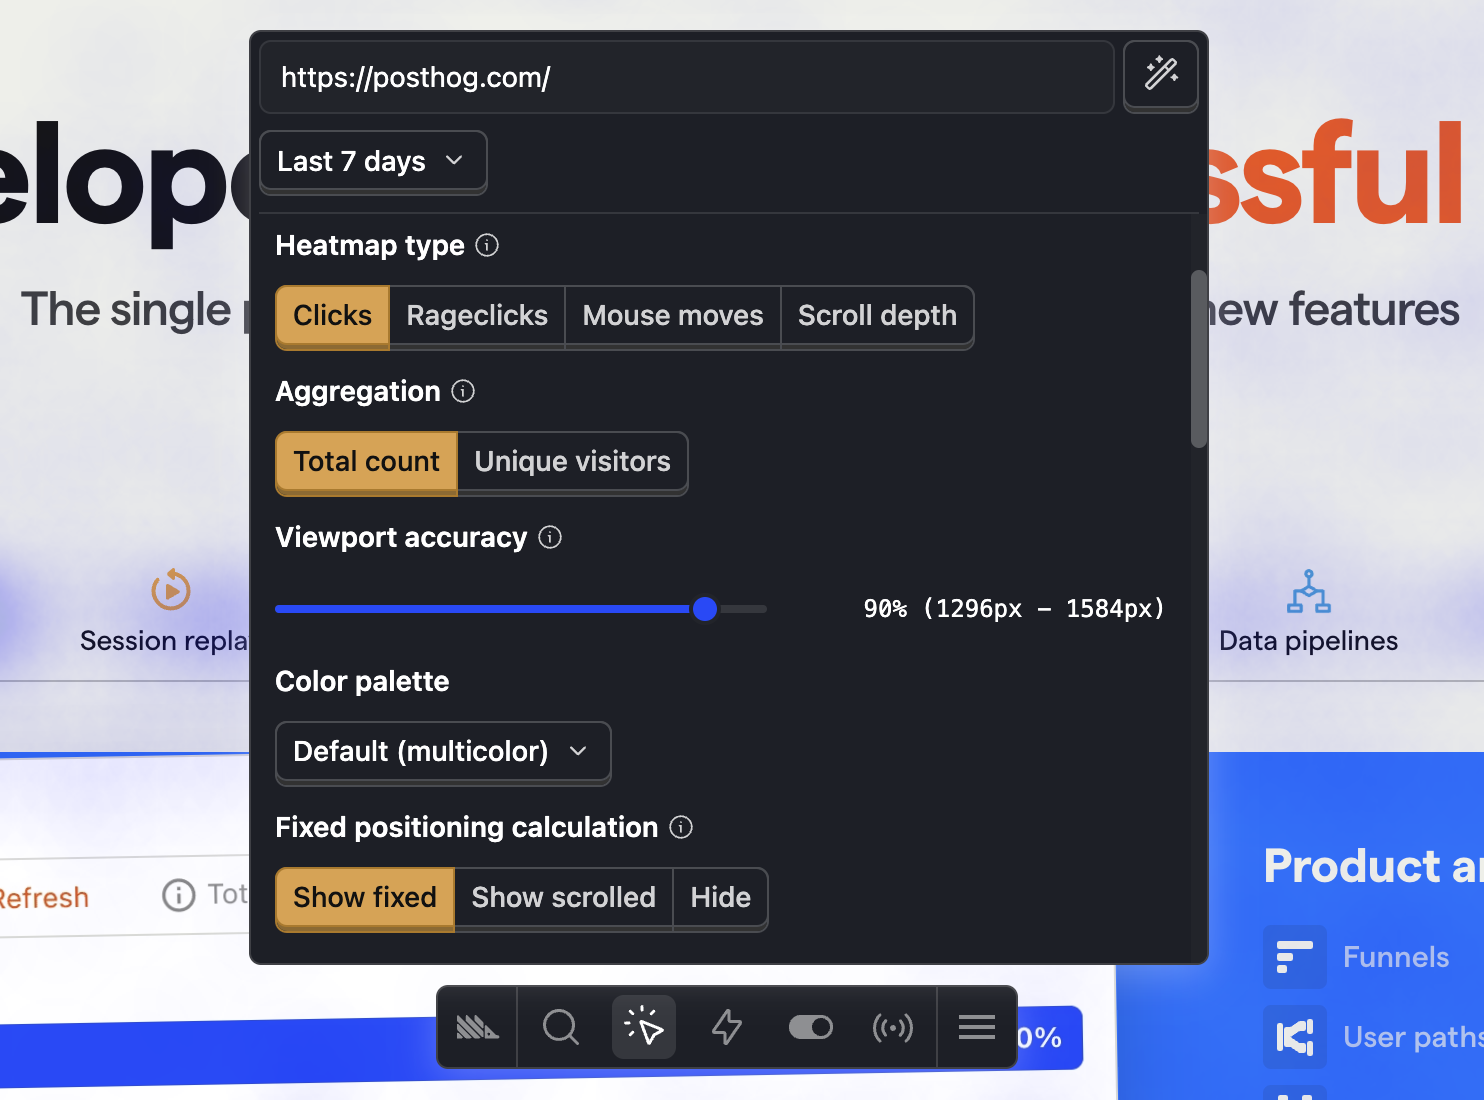
Open the PostHog toolbar and select the heatmap icon to see activity overlaid directly on the page.
Inside PostHog
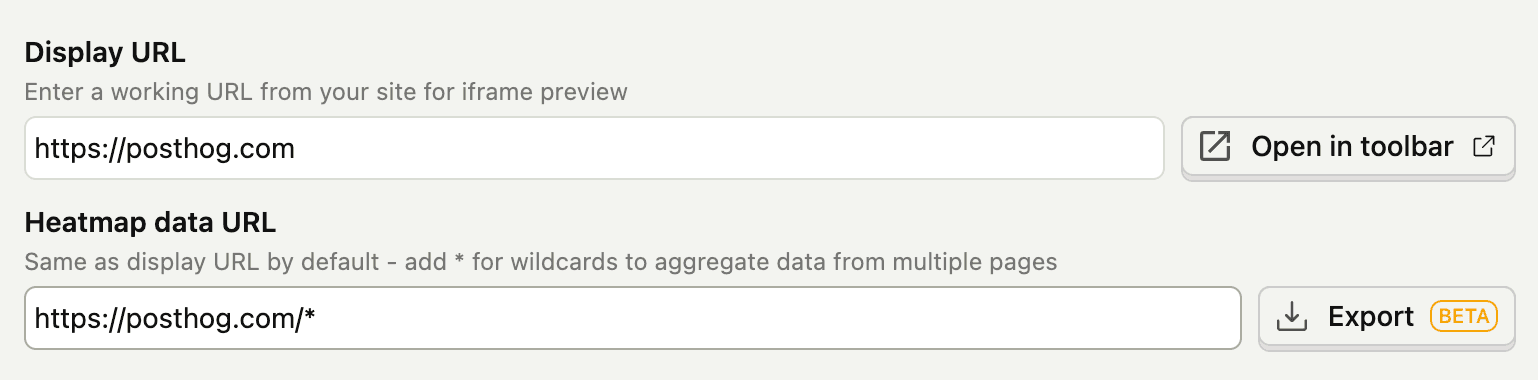
Open Heatmaps, enter the page URL, then use filters or wildcard URL matching to combine similar pages.
Top features
Heatmaps
See mouse movements, clicks, dead clicks, and rageclicks – including attempts to click non-interactive elements.
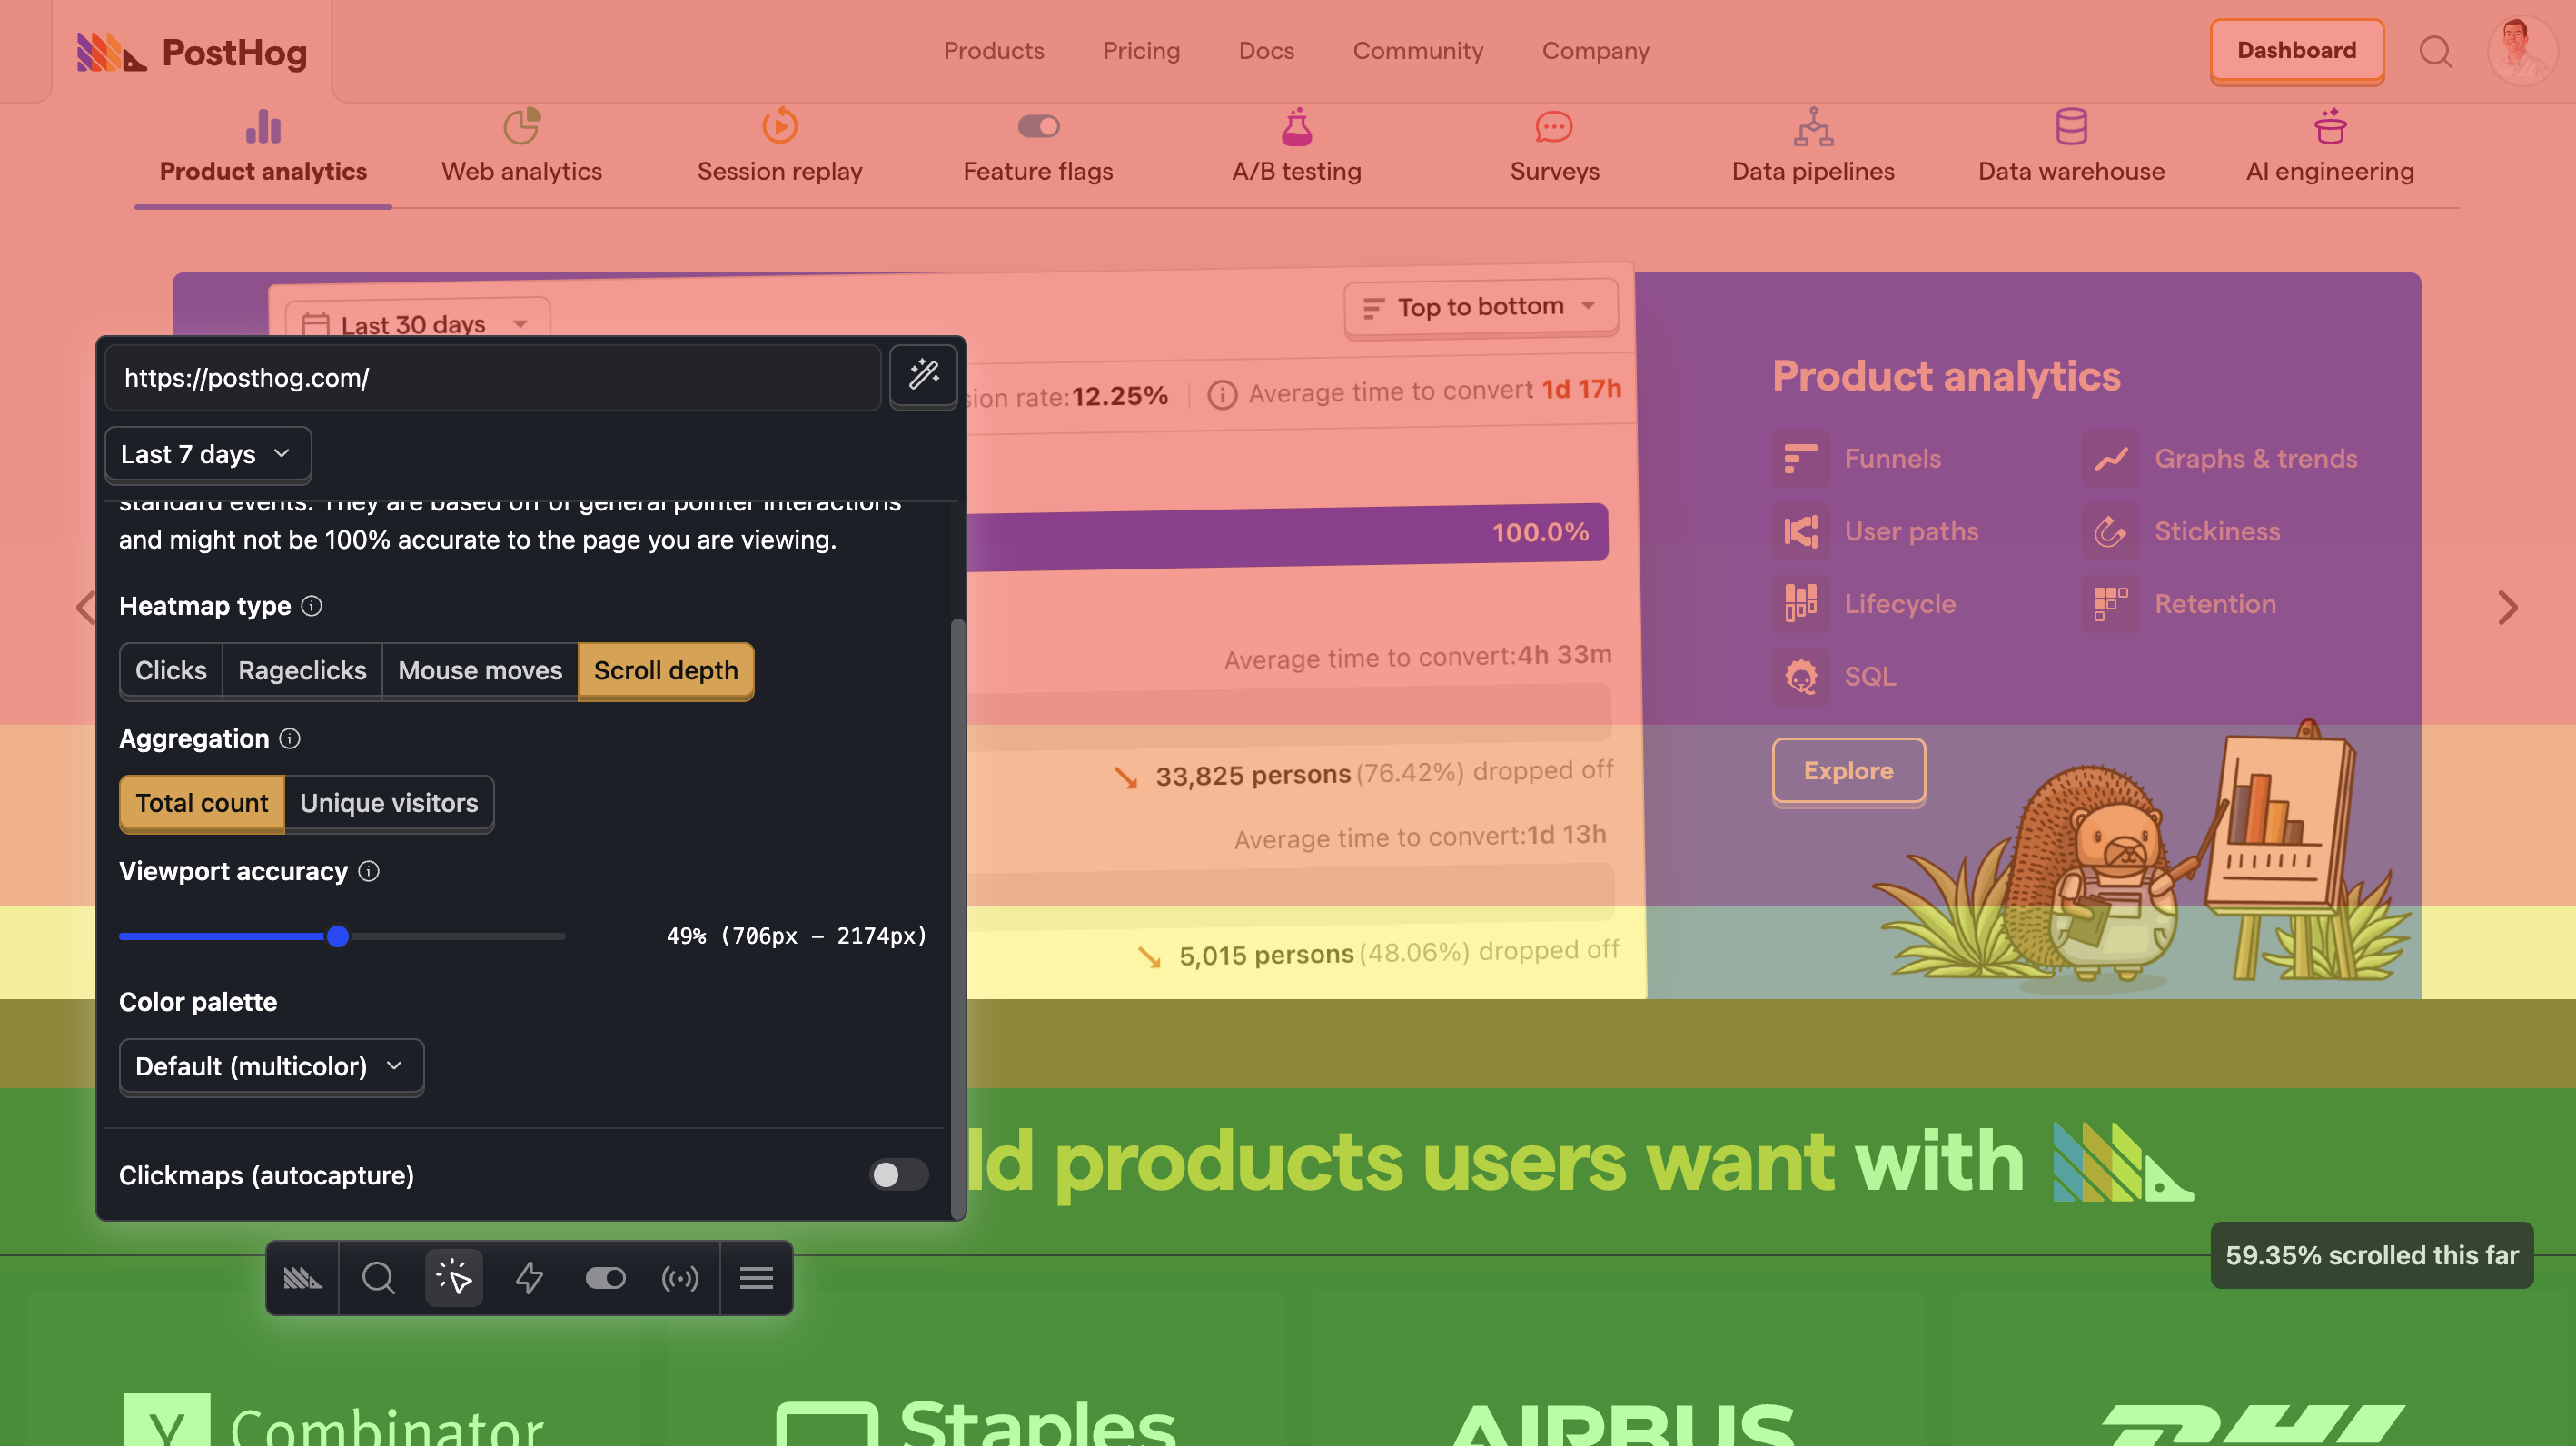
Scrollmaps
Use pageview and pageleave events to see how far people scroll and where they stop.
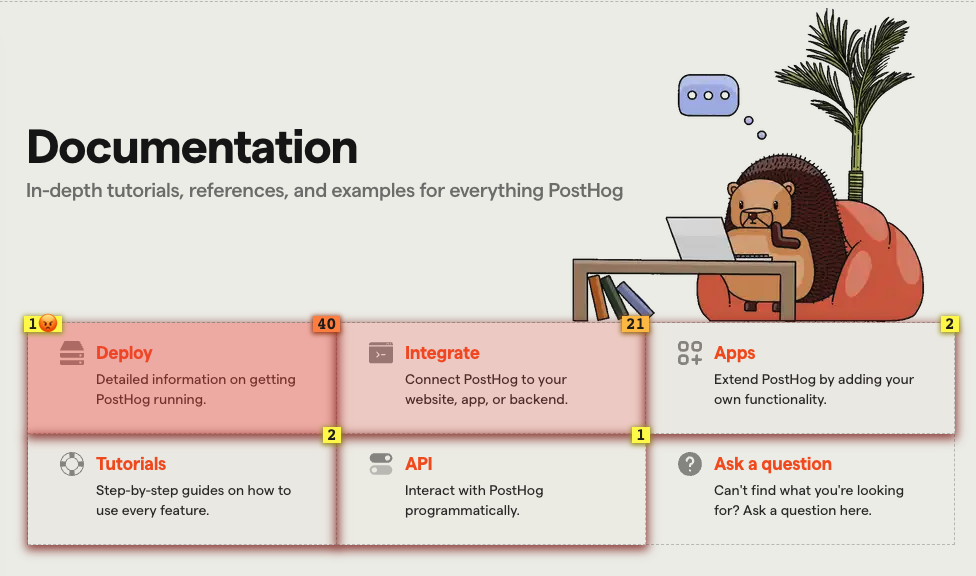
Clickmaps
Use autocapture to show exact click and rageclick counts on clickable elements.
/products/*.Install
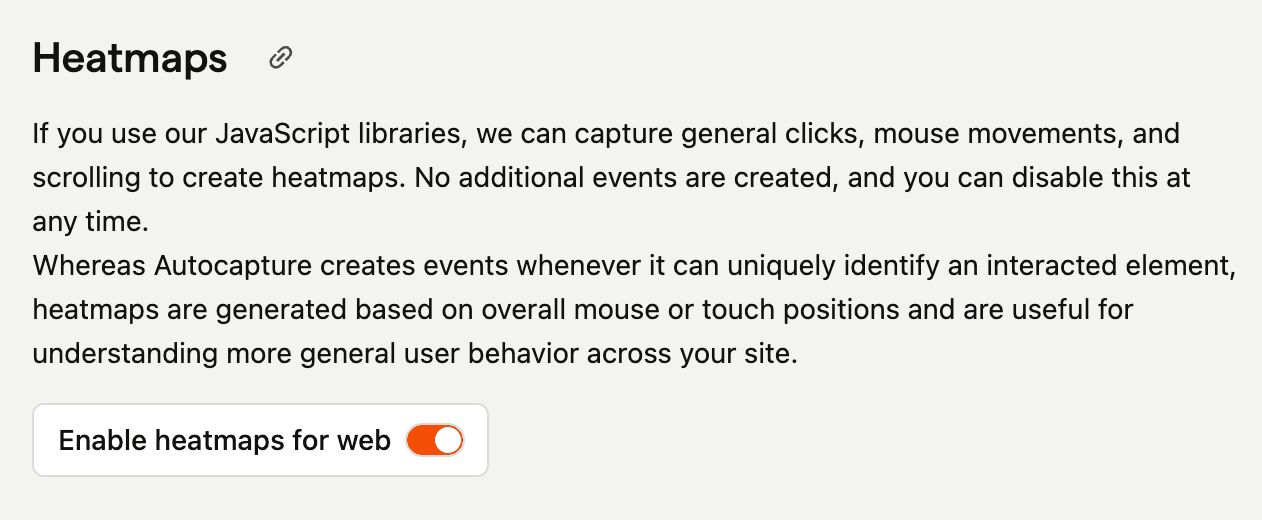
Enable heatmap data capture in your project settings or set enable_heatmaps in the JavaScript SDK. Clickmaps require autocapture and scrollmaps require pageleave events.